
Reporting Process
STOP BIAS reports are initiated by the reporting party, who may or may not be the impacted party/parties. Once a report is made to the University, the reporter receives an automatic acknowledgment of their submission, followed by contact from the University, if requested, within three (3) business days (and usually more quickly). STOP Bias staff/Community Standards, the Department of Public Safety (if requested by the reporter or otherwise warranted), or another member of the Student Experience Division team will contact the reporter to gather more information about the incident and identify options and next steps, which can include referral to the conduct process, Human Resources, or any other appropriate intervention.
Additional University departments, such as the Dean of Students, Office of People and Culture, Student Outreach and Support, Title IX, and the Barnes Center at The Arch will be notified, as appropriate, to provide support. Support service referrals may be declined by the reporting or impacted party/parties.
Reports to STOP BIAS are not included in the Department of Public Safety’s bias incident tracker unless the reporter chooses to refer the incident to the Department of Public Safety, or the nature of the incident requires DPS involvement. To report an incident directly to the Department of Public Safety, please refer to the options on the report a crime page.
Fall 2022 Reported Bias Incidents
Reports have been classified into the categories of bias motivated speech and bias motivated conduct for the purpose of reporting aggregate bias related data. A third category, non-bias incidents, refers to reports of speech and/or conduct which, on the face of the report, does not describe an act or expression of hostility against a person or property of another because of the targeted person’s or group’s real or perceived race, color, creed, religion, sex, gender, national origin, citizenship, ethnicity, marital status, age, disability, sexual orientation, gender identity and gender expression, political affiliation, reproductive health decisions and/or veteran status. Some reports, which are received by STOP BIAS and are included in the bias motivated speech and bias motivated conduct reports, are ultimately found—following an investigation—not to constitute a bias motivated incident.
Bias Motivated Speech is defined as written or verbally communicated language (words said in person, in conversation, printed, or visual communications in electronic form [emails, texts, social media]) targeting a person or group’s protected characteristics. This includes but is not limited to: verbal/written harassment; language or speech (as defined above) that perpetuates a stereotype; use of a slur/epithet; use of a derogatory symbol or image; or unfair treatment.
Bias Motivated Conduct is defined as physical acts or behaviors targeting a person or group’s protected characteristics. This includes but is not limited to: intimidation; threats; physical assault; vandalism; damage or destruction of property; acts that perpetuates a stereotype; or use of a derogatory symbol or image during an act.
An Important Note About the Information Below
A single reported incident could be counted more than once within some of the tables below if multiple identities and/or behaviors were included in the report. Therefore, some numbers below are larger than the total number of reports.
Fall 2022 Breakdown of All Reports by Type of Bias
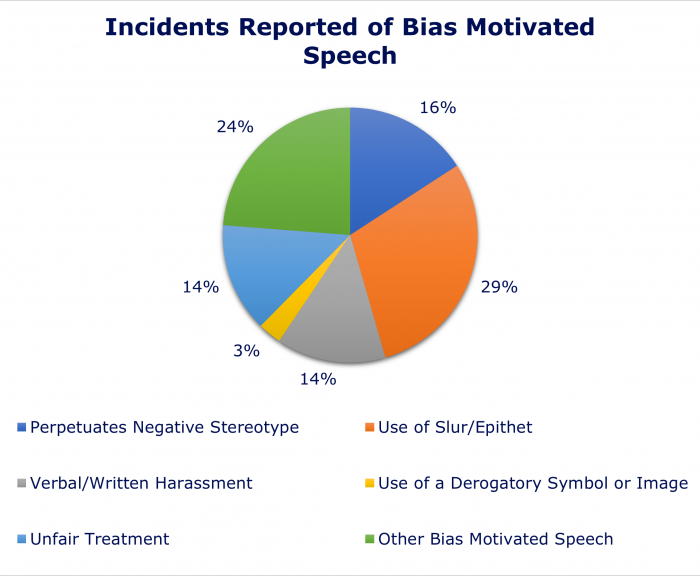
- Perpetuates Negative Stereotype: 16%
- Verbal/Written Harassment: 14%
- Unfair Treatment: 14%
- Use of Slur/Epithet: 29%
- Use of a Derogatory Symbol or Image: 3%
- Other Bias Motivated Speech: 24%
| Type of Bias | Number of Incidents Reported |
|---|---|
| Bias Motivated Speech | |
| Perpetuates Negative Stereotype | 6 |
| Use of Slur/Epithet | 11 |
| Verbal/Written Harassment | 5 |
| Use of a Derogatory Symbol or Image | 1 |
| Unfair Treatment | 5 |
| Other Bias Motivated Speech | 9 |
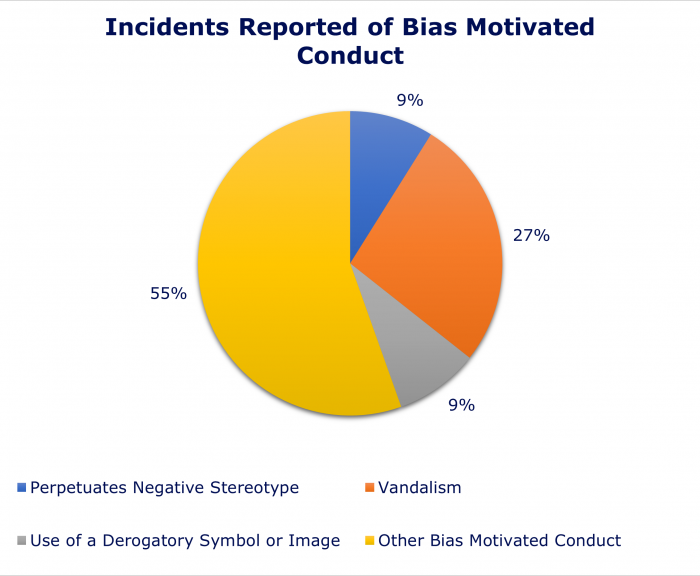
- Vandalism: 27%
- Use of a Derogatory Symbol or Image: 9%
- Perpetuates Negative Stereotype: 9%
- Other Bias Motivated Conduct: 55%
| Type of Bias | Number of Incidents Reported |
|---|---|
| Bias Motivated Conduct | |
| Vandalism | 3 |
| Damage or Destruction of Property | 0 |
| Intimidation/Threats | 0 |
| Physical Assault | 0 |
| Perpetuates Negative Stereotype | 1 |
| Act Using Slur/Epithet | 0 |
| Act Using Derogatory Symbol or Image | 1 |
| Other Bias Motivated Conduct | 6 |
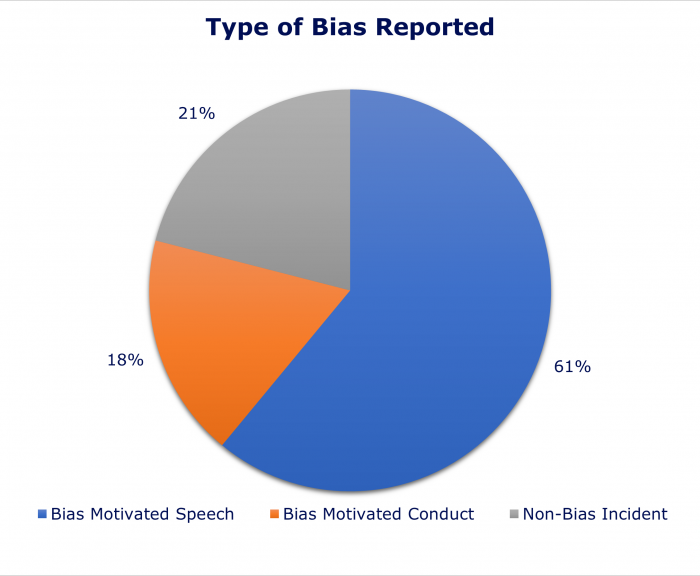
- Bias Motivated Speech: 61%
- Bias Motivated Conduct: 18%
- Non-Bias Incident: 21%
| Type of Bias | Number of Incidents Reported |
|---|---|
| Non-Bias Incident | |
| Report describes non-biased speech or conduct | 13 |
Fall 2022 All Reports by Target of Bias
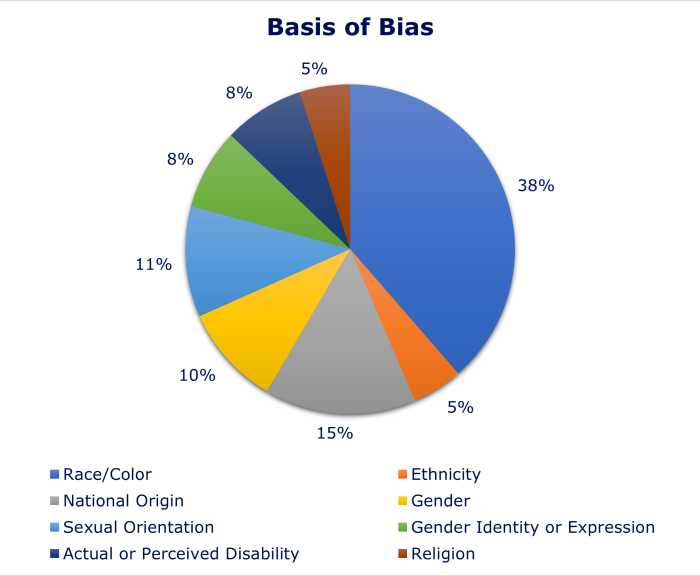
- Race/Color: 38%
- Ethnicity: 5%
- National Origin: 15%
- Gender: 10%
- Sexual Orientation: 11%
- Gender Identity or Expression: 8%
- Actual or Perceived Disability: 8%
- Religion: 5%
| Basis of Bias | Number of Incidents Reported* |
|---|---|
| Based on Race/Color | 24 |
| Based on Ethnicity | 3 |
| Based on National Origin | 9 |
| Based on Gender | 6 |
| Based on Sexual Orientation | 7 |
| Based on Gender Identity or Expression | 5 |
| Based on Actual or Perceived Disability | 5 |
| Based on Age | 0 |
| Based on Religion | 3 |
| Based on Political Affiliation | 0 |
| Based on Marital Status | 0 |
| Based on Veteran Status | 0 |
| Based on Citizenship | 0 |
*A single reported incident may be counted in more than one area, if the report alleges bias based on multiple characteristics. As a result, the total number in each category may represent a larger number than the number of actual reports received.
Fall 2022 All Reports by Location
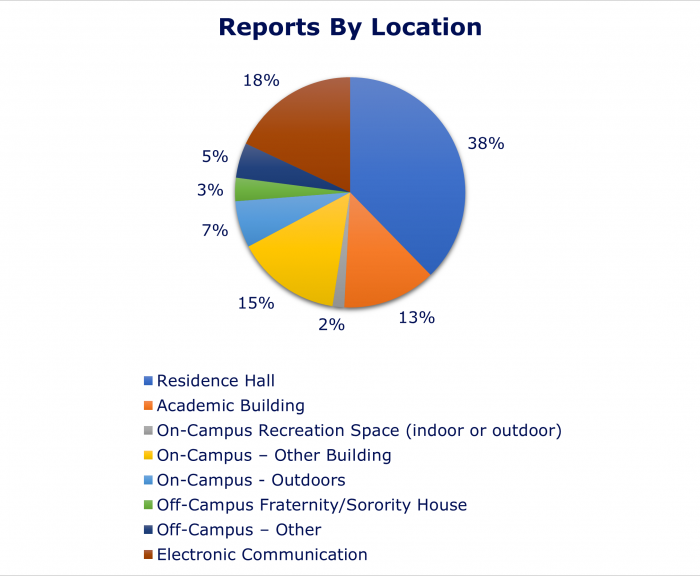
- Residence Hall: 38%
- Academic Building: 13%
- On-Campus Recreation Space (indoor or outdoor): 2%
- On Campus – Other Building: 15%
- On Campus – Outdoors: 7%
- Off-Campus Fraternity/Sorority House: 3%
- Off Campus – Other: 5%
- Electronic Communication: 18%
| Location | Number of Incidents Reported |
|---|---|
| Residence Hall | 23 |
| Academic Building | 8 |
| On-Campus Recreation Space (indoor or outdoor) | 1 |
| On-Campus – Other Building | 9 |
| On-Campus – Outdoors | 4 |
| Off-Campus Fraternity/Sorority House | 2 |
| Off-Campus – Other | 3 |
| Electronic Communication | 11 |
| Unknown | 0 |
Fall 2022 Identity of Accused
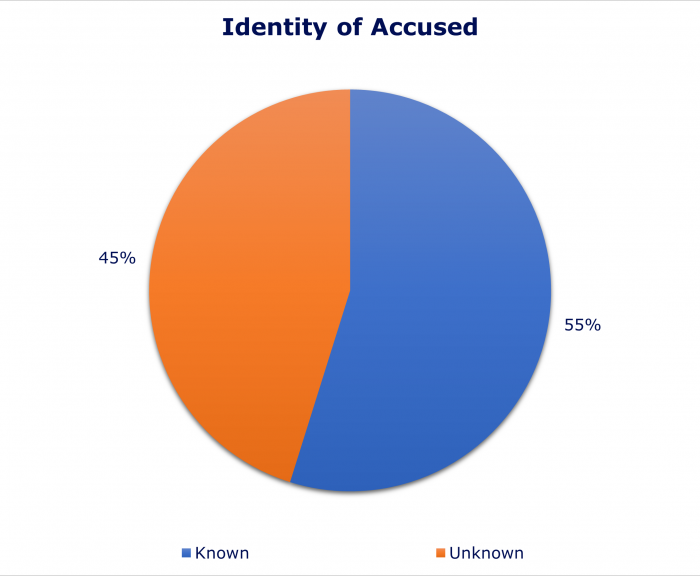
- Known: 55%
- Unknown: 45%
| As identified in the Report | Number |
|---|---|
| Accused | |
| Known | 34 |
| Unknown | 28 |
Fall 2022 Accused Known Affiliation
| As identified in the Report | Number |
|---|---|
| Student | 22 |
| Faculty | 8 |
| Staff | 3 |
| Not Affiliated with the University | 1 |