
The University publishes aggregated data based on reports submitted through the STOP Bias Report System. This data includes reports submitted through the portal but does not reflect the results of investigations or their outcomes. The University shares this data to promote transparency regarding the reports received.
All Reports by Type of Bias
Table 1: All Reports by Type of Bias (Speech)
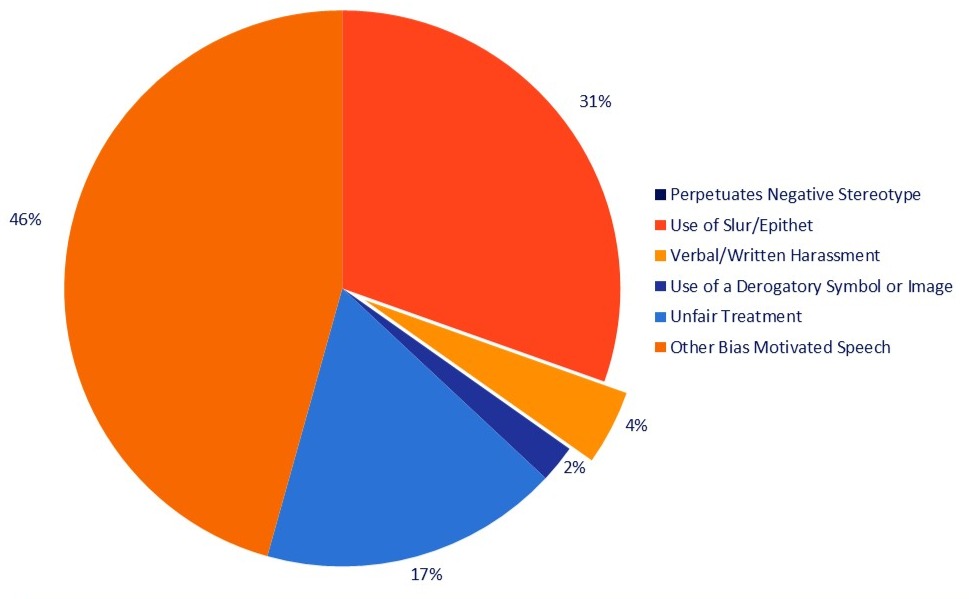
- Perpetuates Negative Stereotype: 0%
- Use of Slur/Epithet: 31%
- Verbal/Written Harassment: 4%
- Use of a Derogatory Symbol or Image: 2%
- Unfair Treatment: 17%
- Other Bias Motivated Speech: 46%
Table 2: All Reports by Type of Bias (Conduct)
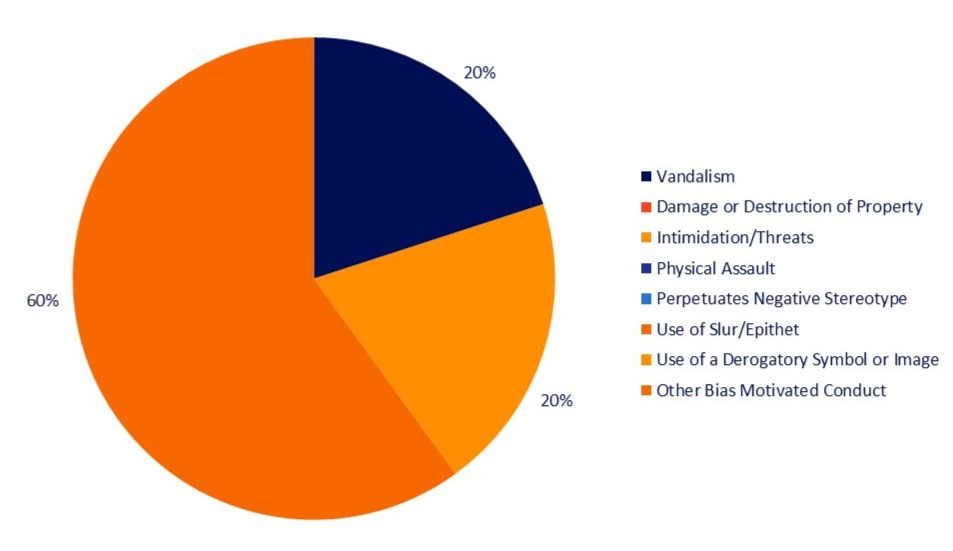
- Vandalism: 20%
- Damage or Destruction of Property: 0%
- Intimidation/Threats: 0%
- Physical Assault: 0%
- Perpetuates Negative Stereotype: 0%
- Use of Slur/Epithet: 0%
- Use of a Derogatory Symbol or Image: 20%
- Other Bias Motivated Conduct: 60%
| Type of Bias | Number of Incidents Reported |
| Bias Motivated Speech | |
| Perpetuates Negative Stereotype | 0 |
| Use of Slur/Epithet | 14 |
| Verbal/Written Harassment | 2 |
| Use of a Derogatory Symbol or Image | 1 |
| Unfair Treatment | 8 |
| Other Bias Motivated Speech | 21 |
| Bias Motivated Conduct | |
| Vandalism | 1 |
| Damage or Destruction of Property | 0 |
| Intimidation/Threats | 0 |
| Physical Assault | 0 |
| Perpetuates Negative Stereotype | 0 |
| Use of Slur/Epithet | 0 |
| Use of a Derogatory Symbol or Image | 1 |
| Other Bias Motivated Conduct | 3 |
| Non-Bias Incident | |
| Report Describes Non-Biased Speech or Conduct | 27 |
Table 3: All Reports by Target of Bias
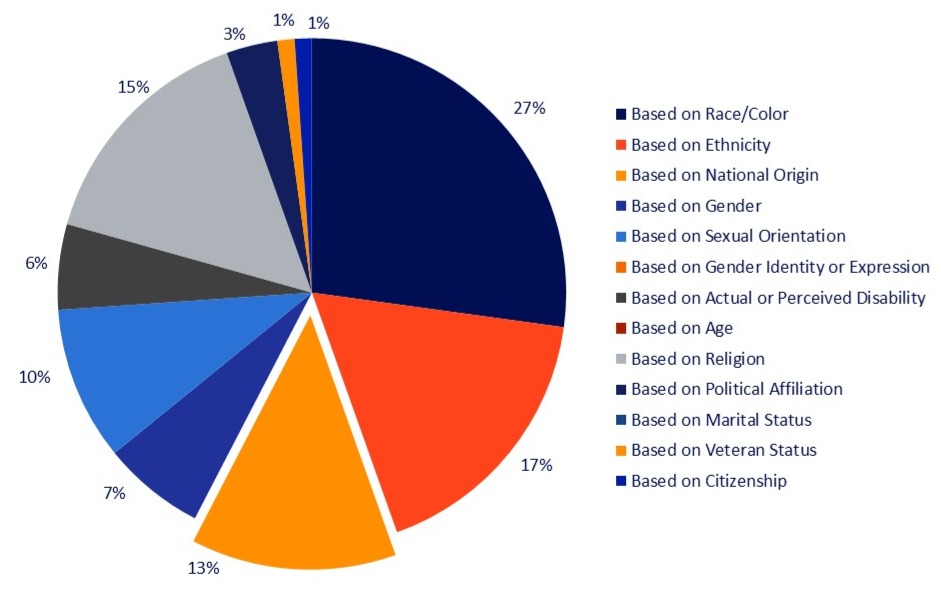
- Based on Race/Color: 27%
- Based on Ethnicity: 17%
- Based on National Origin: 13%
- Based on Gender: 7%
- Based on Sexual Orientation: 10%
- Based on Gender Identity or Expression: 0%
- Based on Actual or Perceived Disability: 6%
- Based on Age: 0%
- Based on Religion: 15%
- Based on Political Affiliation: 3%
- Based on Marital Status: 0%
- Based on Veteran Status: 1%
- Based on Citizenship: 1%
| Basis of Bias | Number of Incidents Reported* |
| Based on Race/Color | 25 |
| Based on Ethnicity | 16 |
| Based on National Origin | 12 |
| Based on Gender | 6 |
| Based on Sexual Orientation | 9 |
| Based on Gender Identity or Expression | 0 |
| Based on Actual or Perceived Disability | 5 |
| Based on Age | 0 |
| Based on Religion | 14 |
| Based on Political Affiliation | 3 |
| Based on Marital Status | 0 |
| Based on Veteran Status | 1 |
| Based on Citizenship | 1 |
Table 4: All Reports by Location
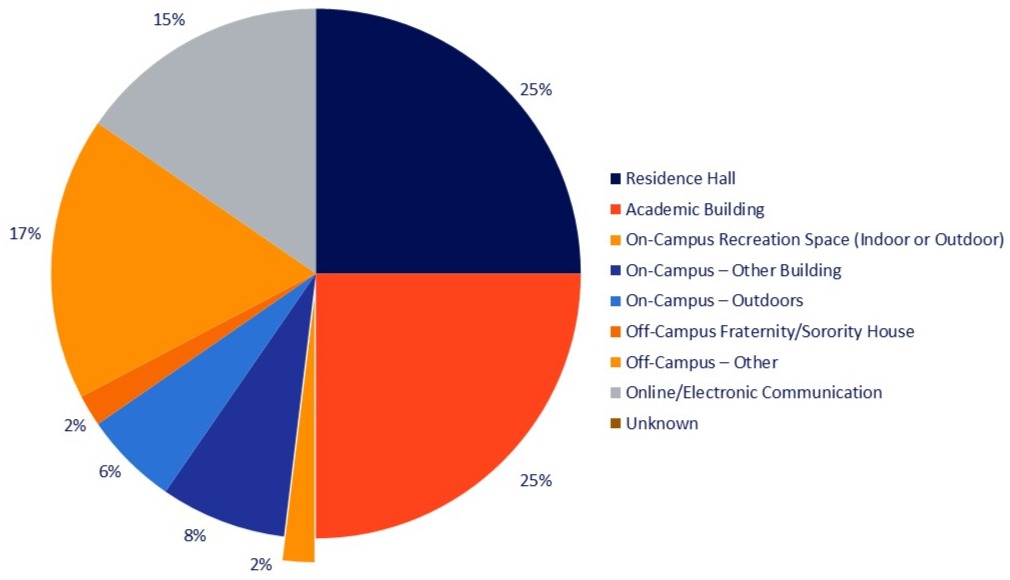
- Residence Hall: 25%
- Academic Building: 25%
- On-Campus Recreation Space (Indoor or Outdoor): 2%
- On-Campus – Other Building: 8%
- On-Campus – Outdoors: 6%
- Off-Campus Fraternity/Sorority House: 2%
- Off-Campus – Other: 17%
- Online/Electronic Communication: 15%
- Unknown: 0%
| Location | Number of Incidents Reported |
| Residence Hall | 13 |
| Academic Building | 13 |
| On-Campus Recreation Space (Indoor or Outdoor) | 1 |
| On-Campus – Other Building | 4 |
| On-Campus – Outdoors | 3 |
| Off-Campus Fraternity/Sorority House | 1 |
| Off-Campus – Other | 9 |
| Online/Electronic Communication | 8 |
| Unknown | 0 |
Identity of Reporter and Accused
Table 5: Fall 2024 Identity of Accused
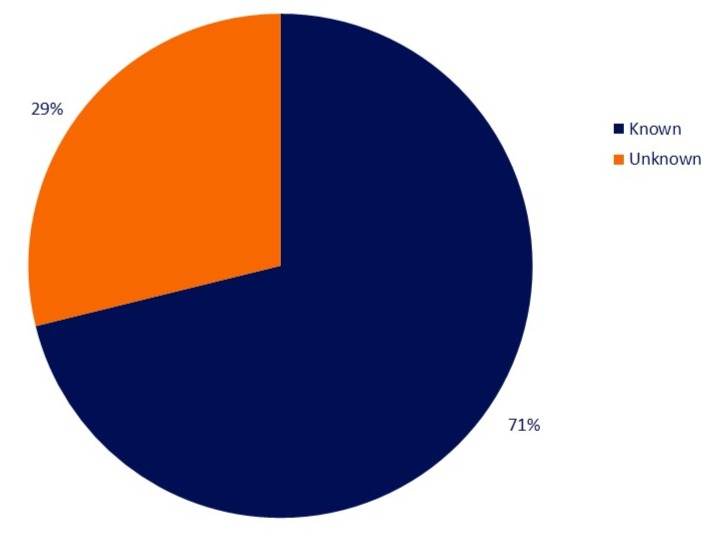
- Known: 71%
- Unknown: 29%
| As Identified in the Report | Number |
| Reporter | |
| Known | 48 |
| Anonymous | 4 |
| Accused | |
| Known | 37 |
| Unknown | 15 |
Table 6: Accused Affiliation
| As Identified in the Report | Number |
| Student | 24 |
| Faculty | 8 |
| Staff | 0 |
| Not Affiliated with the University | 4 |
| Unknown | 16 |